Farenet

FareNet Reporting Suite

Insights into demand powered by real-time user search data

FareNet is PROS’s proprietary script that collects User Search Data from our clients’ internet booking engines (IBE) in real-time. As users search for flight fares, FareNet captures the search results and sends new low fares to be populated across the web.

With FareNet data, airlines can analyze trends and make data-driven business decisions. Click any of the dashboard titles below to jump to that section:

Search Volume Dashboard

Average Fare Trajectory

Search to Fly Window

Trip Length Dashboard

Actionable Booking Engine

Actionable Markets

Demand and Bookings by Departure Date and Route

Demand by Destination and Departure Month

Historic Daily Demand and Bookings

Daily Searches by Route

FareNet data powers airTRFXairModulesairWireairSEM, and provides airlines with real-time dashboards to leverage user search data as a decision-making tool. With FareNet Dashboards, airlines can identify their most strategic routes in real-time and understand the gap between search volume and load factor in order to identify opportunities for fare adjustments.

Absolutely no personally identifiable information of site visitors is collected or stored at any time. FareNet only collects flight and fare information already available to any user searching for a flight.

Airlines that have implemented FareNet have access to the FareNet dashboards via airTRFX Control:
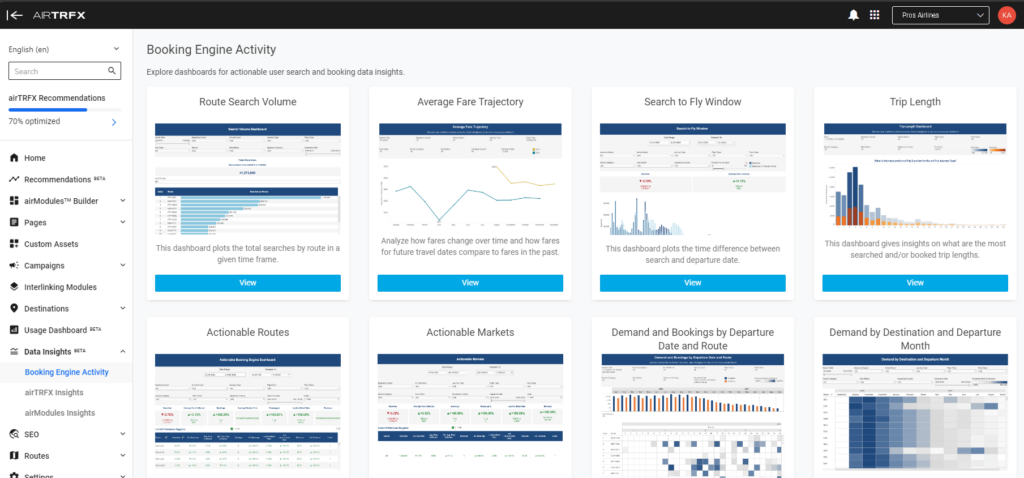
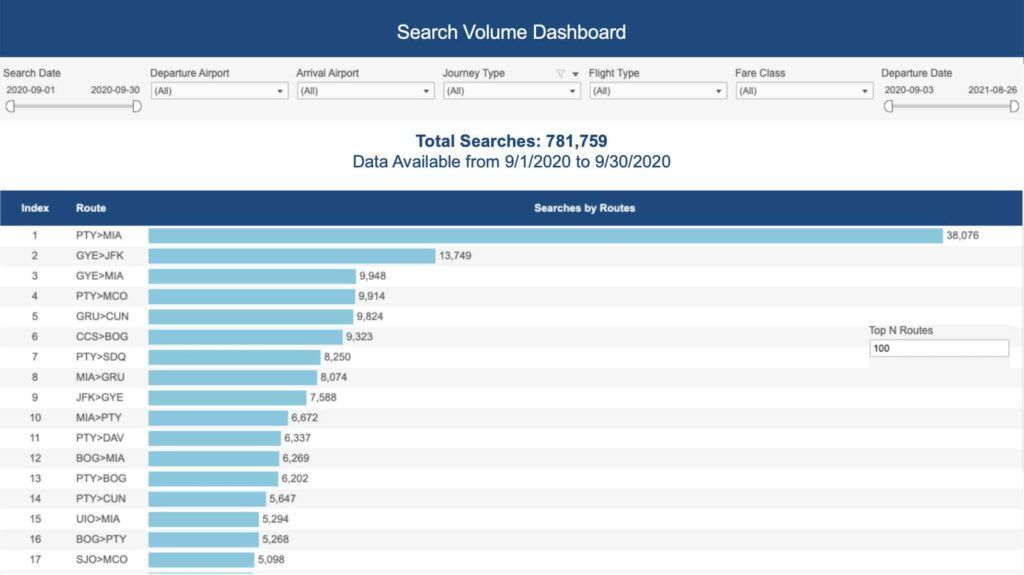
This dashboard plots the total searches by route in a given time frame. This information can be helpful for airTRFX Control users to decide which routes to include in airTRFX or to understand if there’s enough search volume to populate the Fare airModules. Airlines can also decide which routes to include in PROS’s Refresher system if some routes need to be advertised and the search volume is not available at the moment. This information can be analyzed by site edition, specific origin, specific destination or even type of route by selecting the different filters available. See the interactive Search Volume Dashboard with sample airline data >

Average Fare Trajectory

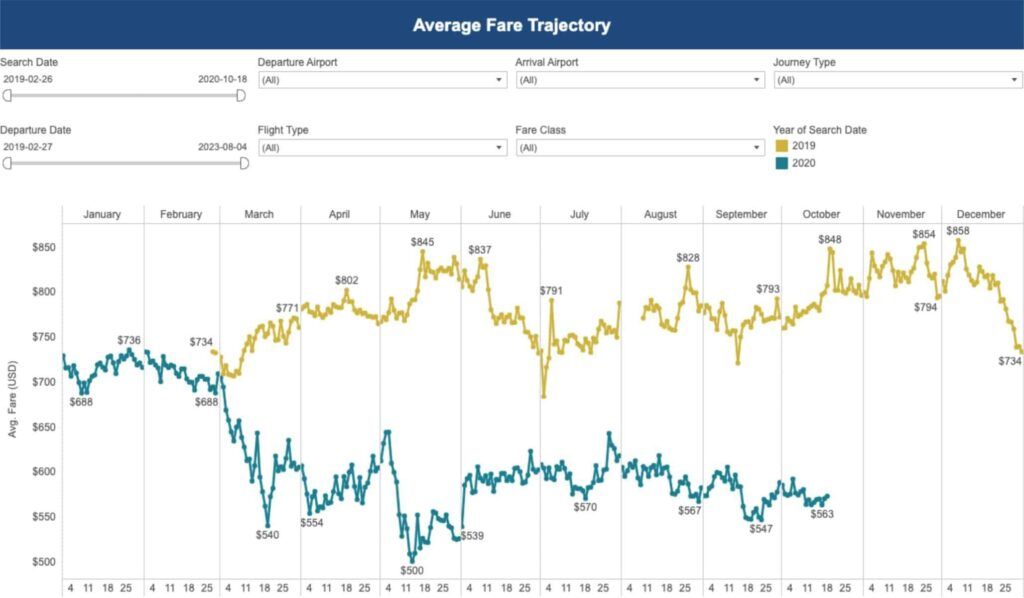
This dashboard helps to analyze how fares change over time and how fares for future travel dates compare to fares in the past. The fare is based on the average fare seen by users from all daily searches. The graph plots by default the average monthly fare and provides daily trajectory by using the tool-tip. Airlines can use this data to explain campaign behavior based on fare changes. For example, why did a route sell last year, but not this year? The information can be segmented by route, flight type, journey type, site edition, and device. See the interactive Average Fare Trajectory dashboard with sample airline data >
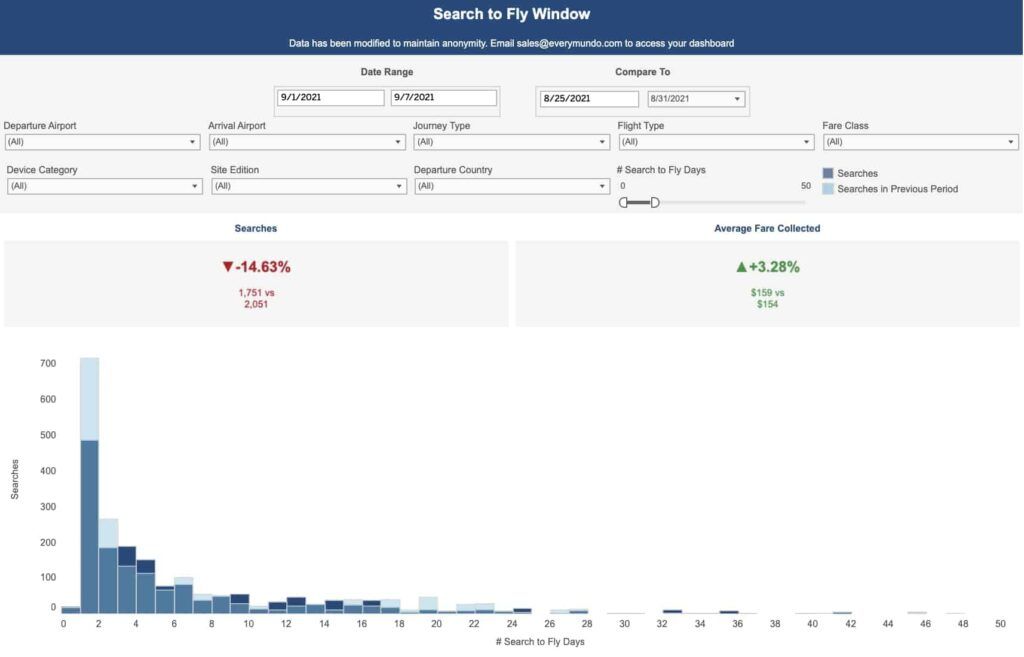
This dashboard plots the time difference between search and departure date. FareNet collects the search date and also the travel dates of the route that the user is looking for. Airlines can use this dashboard to analyze the time window between the search date for all or specific routes and the final travel date to inform the right time to invest in media for certain routes or types of routes. Airlines can segment this information by market or travel class to understand how behavior changes and make marketing decisions around the interest and location of the user. For example, if an airline notices that routes for a specific airport have fewer searches than the previous period 20 days before departure, the airline may utilize this information to create a new campaign for that airport. See the interactive Search to Fly Window dashboard with sample airline data >

Trip Length Dashboard

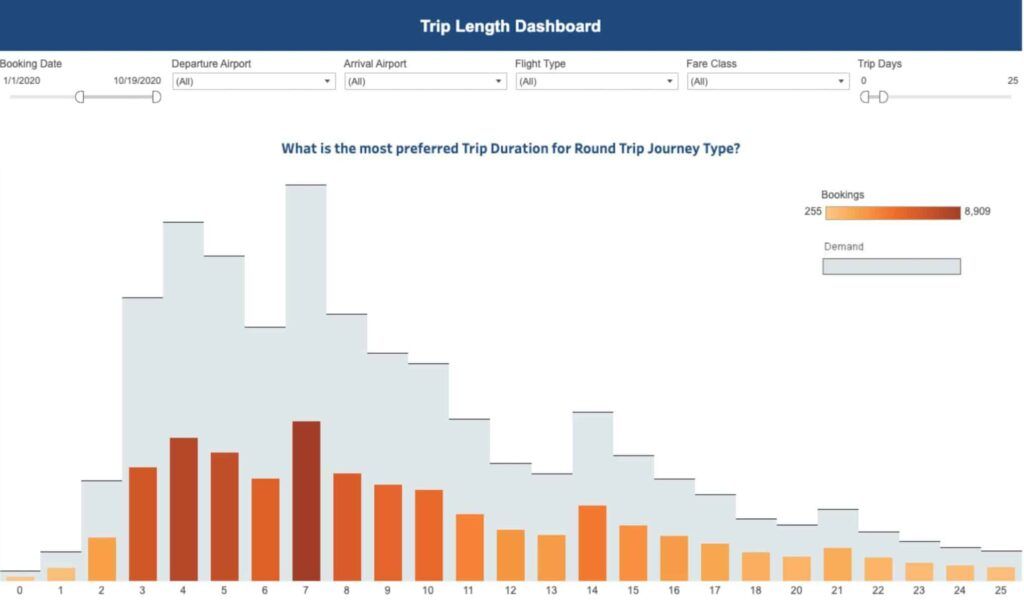
This dashboard gives insights on what are the most searched and/or booked trip lengths. Airlines can analyze the most searched trip length for a specific route, origin, or specific market. These insights allow airlines to make marketing decisions such as pre-populating the Flight Search Panel with predicted trip length or adjust the Fare airModules to minimum or maximum trip lengths. This view might be restricted for some airlines where fares and data collection are restricted to One-Way. See the interactive Trip Length Dashboard with sample airline data >

Actionable Booking Engine Dashboard

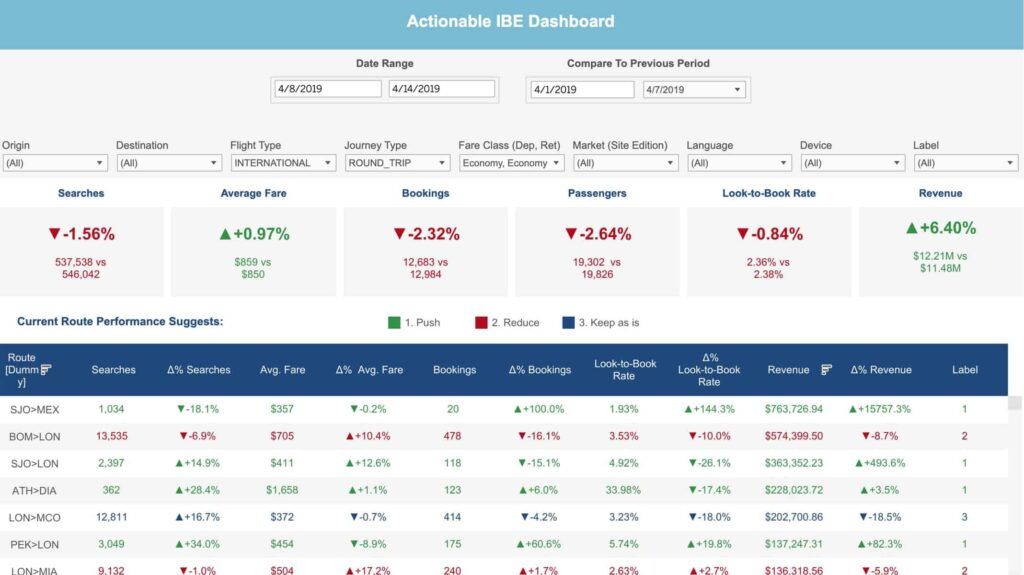
Centralized real-time route performance in one dashboard highlighting actionable routes based on changes in search behavior, fares and conversions by route compared to previous periods. The dashboard facilitates route-based data-driven decision-making. The routes that need attention are automatically highlighted, so that users instantly know for which routes to push, reduce, or keep as is the investment. Routes can be segmented by flight type, journey type, fare class, market, language, and device. This information can be used by revenue management or marketing teams to check the load factor and either increase / decrease fares to capitalize on/create demand. See the interactive Actionable IBE Dashboard with sample airline data >

Actionable Markets

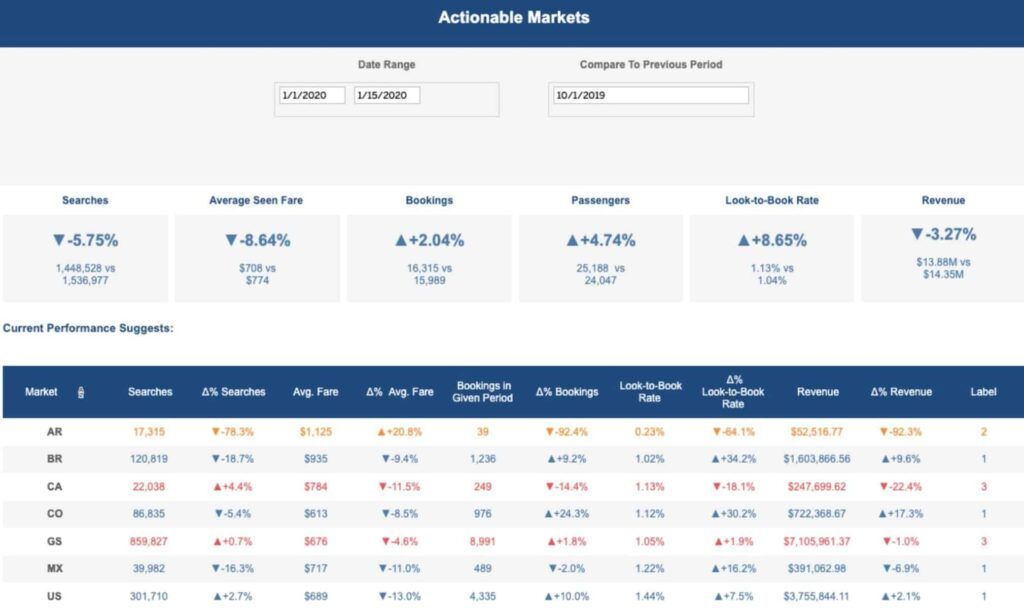
Similar to the Actionable IBE Dashboard, airlines can see changes in search behavior, fares and conversions compared to previous periods by market. The dashboard facilitates market-based data-driven decision-making. The markets that need attention are automatically highlighted, so that users instantly know for which markets to push, reduce, or keep as is the marketing investment. Markets can be segmented by flight type, journey type, fare class, market, language, and device. See the interactive Actionable Markets Dashboard with sample airline data >

Demand and Bookings by Departure Date and Route
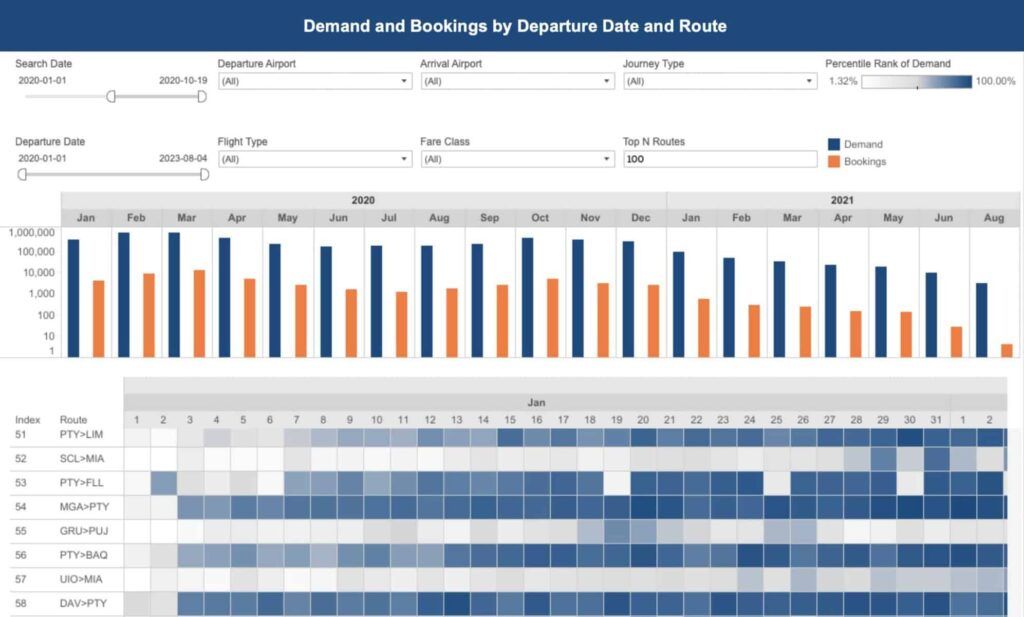
This dashboard shows an airline the search and booking volume from their website by route and day for the next 365 days. This is a decision-making tool for network planning, reopening routes and increasing frequencies of existing routes based on the user interest. Airlines can use this information to plan which routes to focus on marketing and reopening first as they are the most likely flights to sell tickets. The number of searches and approximate number of bookings by travel date across all the routes of the airline. The first summary bar graph provides a quick glance on the number of searches and bookings while the graph below plots demand by popular travel dates. Airlines can get additional granular information for each date and route on the grid by using the tooltip. Each box displays the departure date, the number of searches for this route departing on this date and how the number searches for this route rank against the number of searches for other routes in the airline’s network as a percentile. The darker the color, the more demand for a given travel date. See the interactive Demand by Departure Date Dashboard with sample airline data >

Demand by Destination and Departure Month
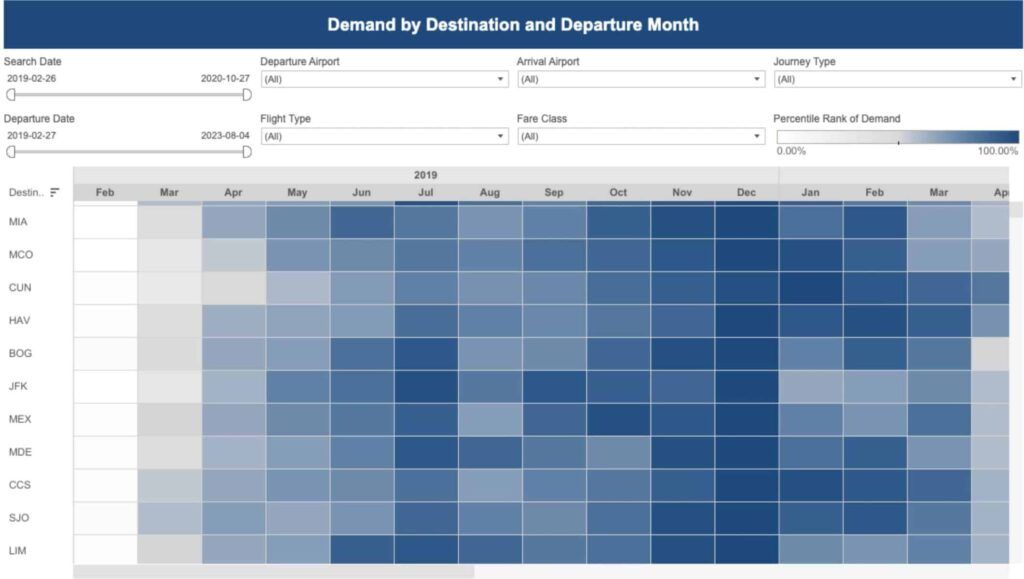
The Demand by Departure Date dashboard highlights popular travel months users are currently searching for by Destination of choice. Customers use this dashboard to develop their content strategy for destination marketing. Understand at what rate flights in a given month are being booked. Analyze the number of searches by travel date and how that compares to the amount of bookings that have been completed. This can help marketers launch campaigns and RM optimize pricing to motivate travel for specific dates. See the interactive Demand by Destination and Departure Month Dashboard with sample airline data >

Historic Daily Demand and Bookings

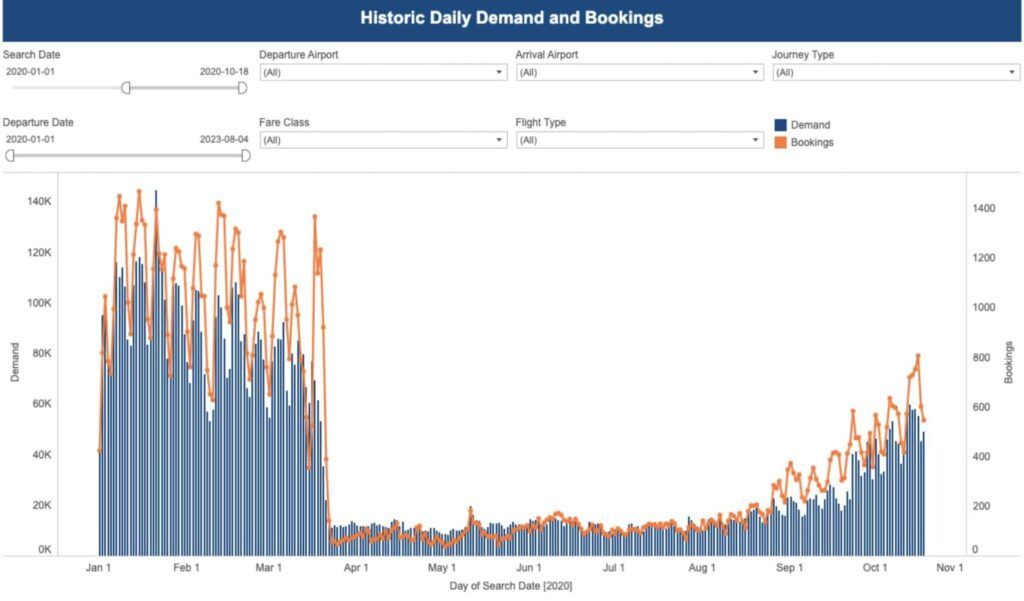
This dashboard provides airlines with a daily historic view (last 60 days) of the search and booking trend for a given route or multiple routes. With this information, airlines can determine how look-to-book ratios change over time and how specific marketing tactics are helping increase search interest and bookings. If airlines do not have FareNet in the confirmation page, only historic daily search volume will be provided. See the interactive Historic Daily Demand and Bookings Dashboard with sample airline data >

Daily Searches by Route

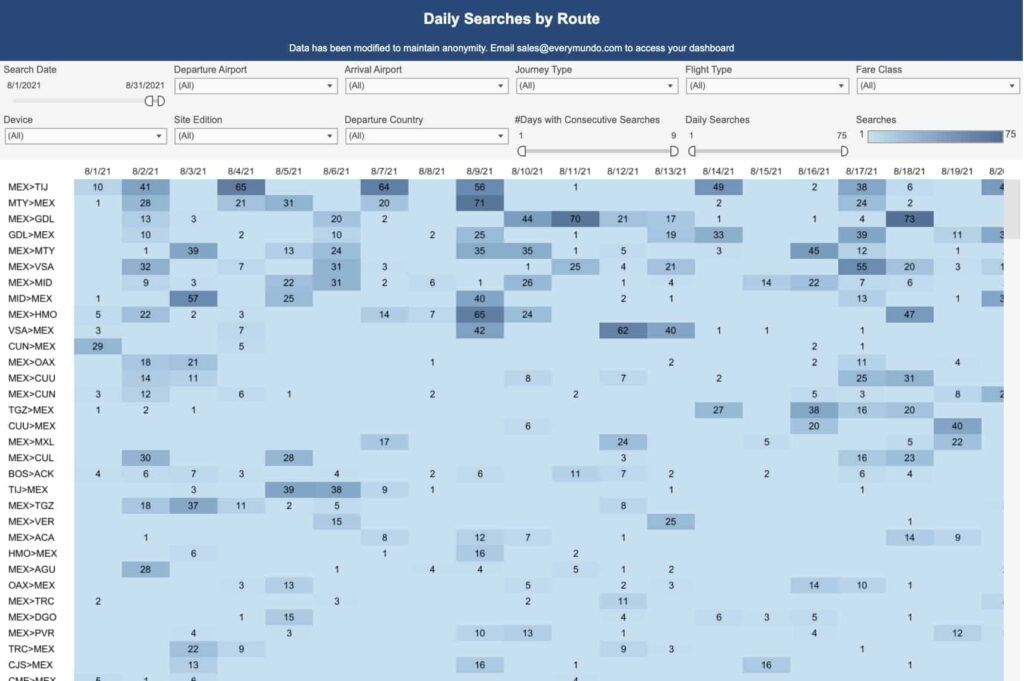
This dashboard helps to analyze how many days with consecutive searches a given route has. This data can help airlines decide which routes to add to airTRFX Control to generate route and destination airTRFX pages with sufficient fare data to power airModules. In addition, this dashboard can help airlines evaluate the impact of any recent marketing campaigns and assess if the efforts have lead to an increased daily number of searches in the airline’s booking engine. See the interactive Daily Searches by Route Dashboard with sample airline data >