
A little over a year ago, I stepped into the role of a Product Manager and our team embarked on a journey to transform how our neural network powered AI pricing software communicates its decisions to users. This was not just about adding new features or improving performance—it was about opening AI’s black box and making its recommendations clear and understandable.
The initiative we called Aggregate Analytics was born out of a desire to help our customers trust our neural network AI pricing recommendations more deeply by providing transparency. Fast forward to today, and after a year of hard work, collaboration, and iteration, I’m proud to share how this journey unfolded and the results we can now demonstrate.
The Spark: Why We Needed Explainability
As AI continues to reshape pricing strategies across industries, one challenge consistently emerged in our conversations with customers: explainability. While AI could deliver powerful recommendations, the question of “why this price?” was a recurring theme. Customers wanted to know more than just what the AI suggested—they wanted to understand the logic behind it.
This need sparked the Aggregate Analytics initiative, which aimed to make the decision-making process of our AI visible and actionable. Our goal? Provide a suite of tools that gives users clarity into not only what our AI is doing but also why.
Building the Vision: Five Key Features
Our vision for Aggregate Analytics revolved around five key features, each designed to tackle a different aspect of explainability in AI pricing:
- Uplift Analysis
- Model Health
- Top Performers
- Attribute Influence
- Trend Analysis
Each feature addressed a real business challenge, giving customers the ability to interact with AI-powered data in ways that made sense to them. But building these features was no small feat—it required input from various teams across the company and a lot of collaboration.
Where Science Meets Business
From day one, we knew that delivering on the vision for Aggregate Analytics would take more than just great engineering. It was going to take collaboration between our engineering, science, sales, customer success, and professional services teams. Each group brought a unique perspective, and I quickly learned that pulling in insights from every corner of the organization was crucial to the success of this project.
- Engineering and Science: These teams were the heartbeat of the initiative. They ensured the accuracy of the data and built the technical infrastructure to support real-time analytics. I spent countless hours in discussions with our science team to understand how we could surface complex neural network outputs in a way that would be meaningful to customers.
- Sales and Customer Success: While we were developing, the sales and customer success teams played an essential role in shaping the features from the customer’s point of view. They helped us refine the outputs to ensure the insights were actionable and easy to interpret, grounding the technical innovation in real-world use cases.
- Professional Services: Throughout the process, professional services provided valuable feedback, helping us understand the specific business needs of our users and how they would engage with the tools. This allowed us to shape the features in ways that truly addressed those needs.
The Journey of Each Feature
As we moved forward, each feature evolved through feedback, testing, and iteration. Here’s a behind-the-scenes look at how they came to life:
- Uplift Analysis: Showing the Impact
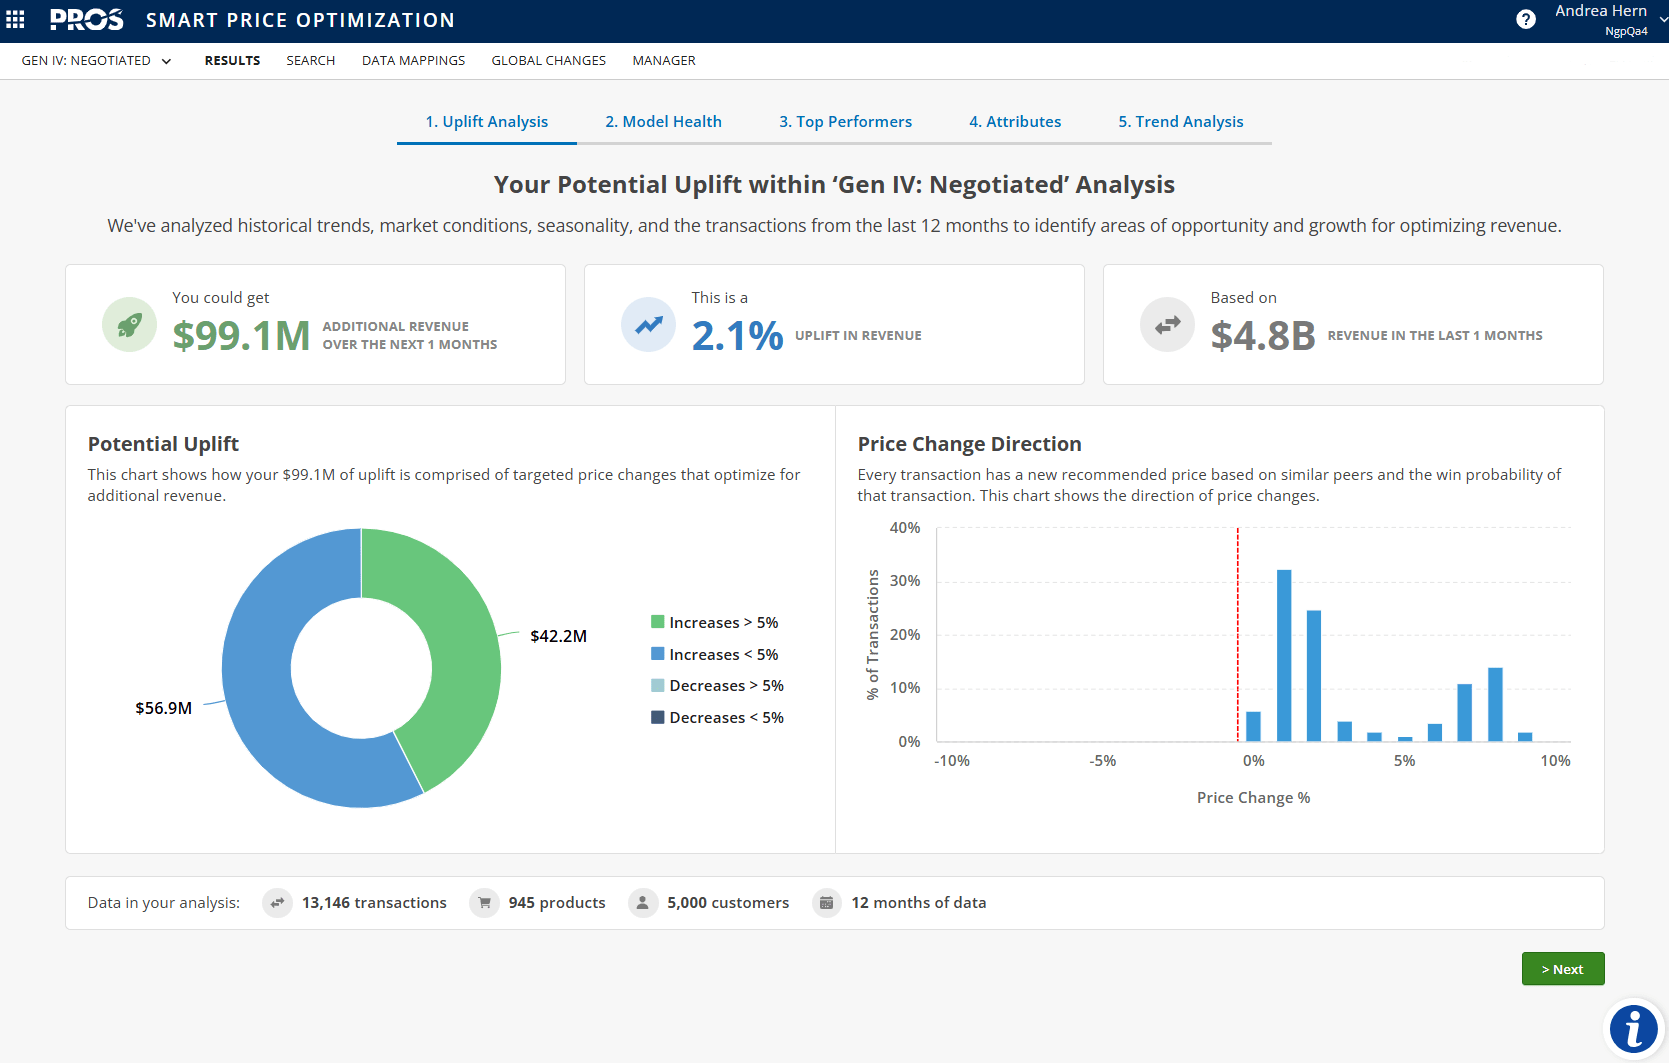
One of the biggest hurdles in AI pricing is demonstrating the tangible value it brings. Without clear, quantified benefits, skepticism can grow around AI-driven decisions. This feature was all about giving customers the ability to visualize the potential revenue or margin uplift our AI could generate. Early versions of the tool were simple, but as we worked closely with our sales and UX teams, we added more nuanced breakdowns, like price change direction and percentage changes, to offer richer insights. By the end, Uplift Analysis has become a powerful tool to demonstrate the ROI of AI-driven pricing changes.
- Model Health: Building Trust
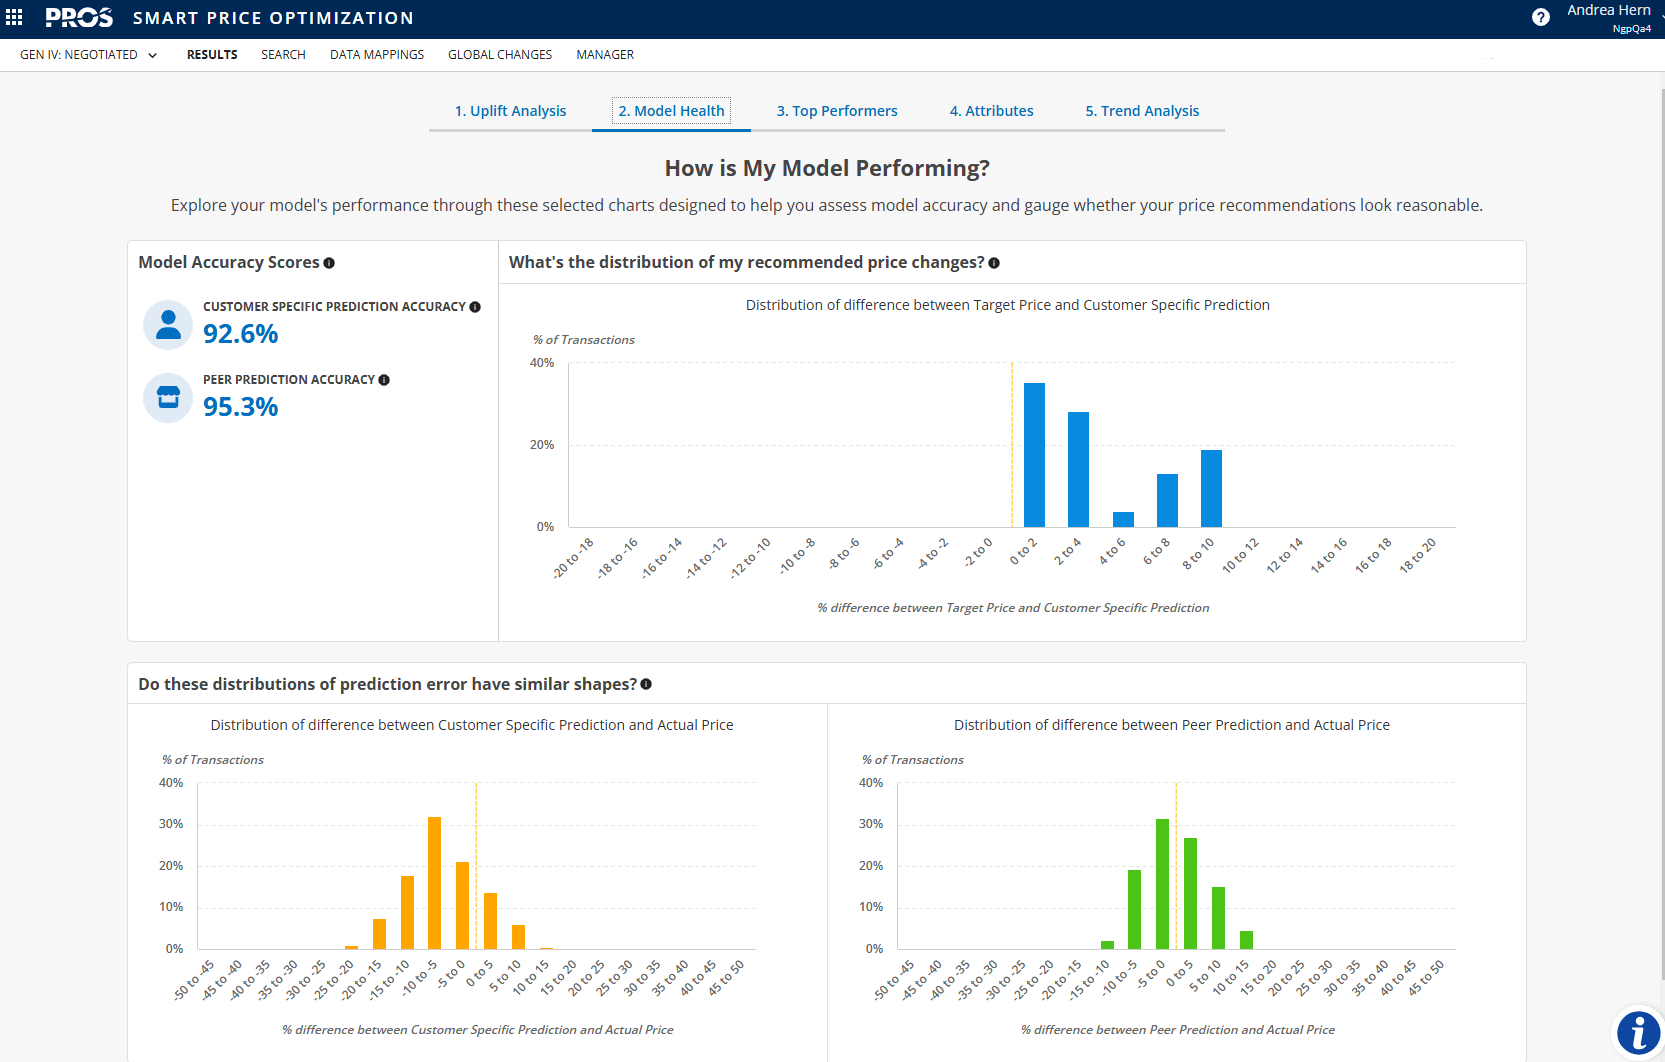
As customers relied more on AI, the need for reassurance that the model was performing optimally became evident. Building trust in AI recommendations is challenging if users can’t see how well the models are performing. The Model Health screen evolved from just a technical tool into a dashboard where customers could monitor the accuracy of predictions, broken down into customer-specific and peer predictions. This turned into a key feature for boosting confidence in the system, enabling an at-a-glance view to validate the AI’s pricing recommendations without the need of a data scientist.Gabor Toth, Senior Revenue Manager at Spire Healthcare Limited, recently confirmed that trusting the recommendations of PROS Neural Networks has been a key aspect for them:
“In regards to the accuracy – every single time we run the model on a new data set, on the Health Monitor page, we can see how actually the model performs, showing everyone in our organization that actually it does work, and the recommended prices are correct and usable.“
- Top Performers: Prioritizing What Matters
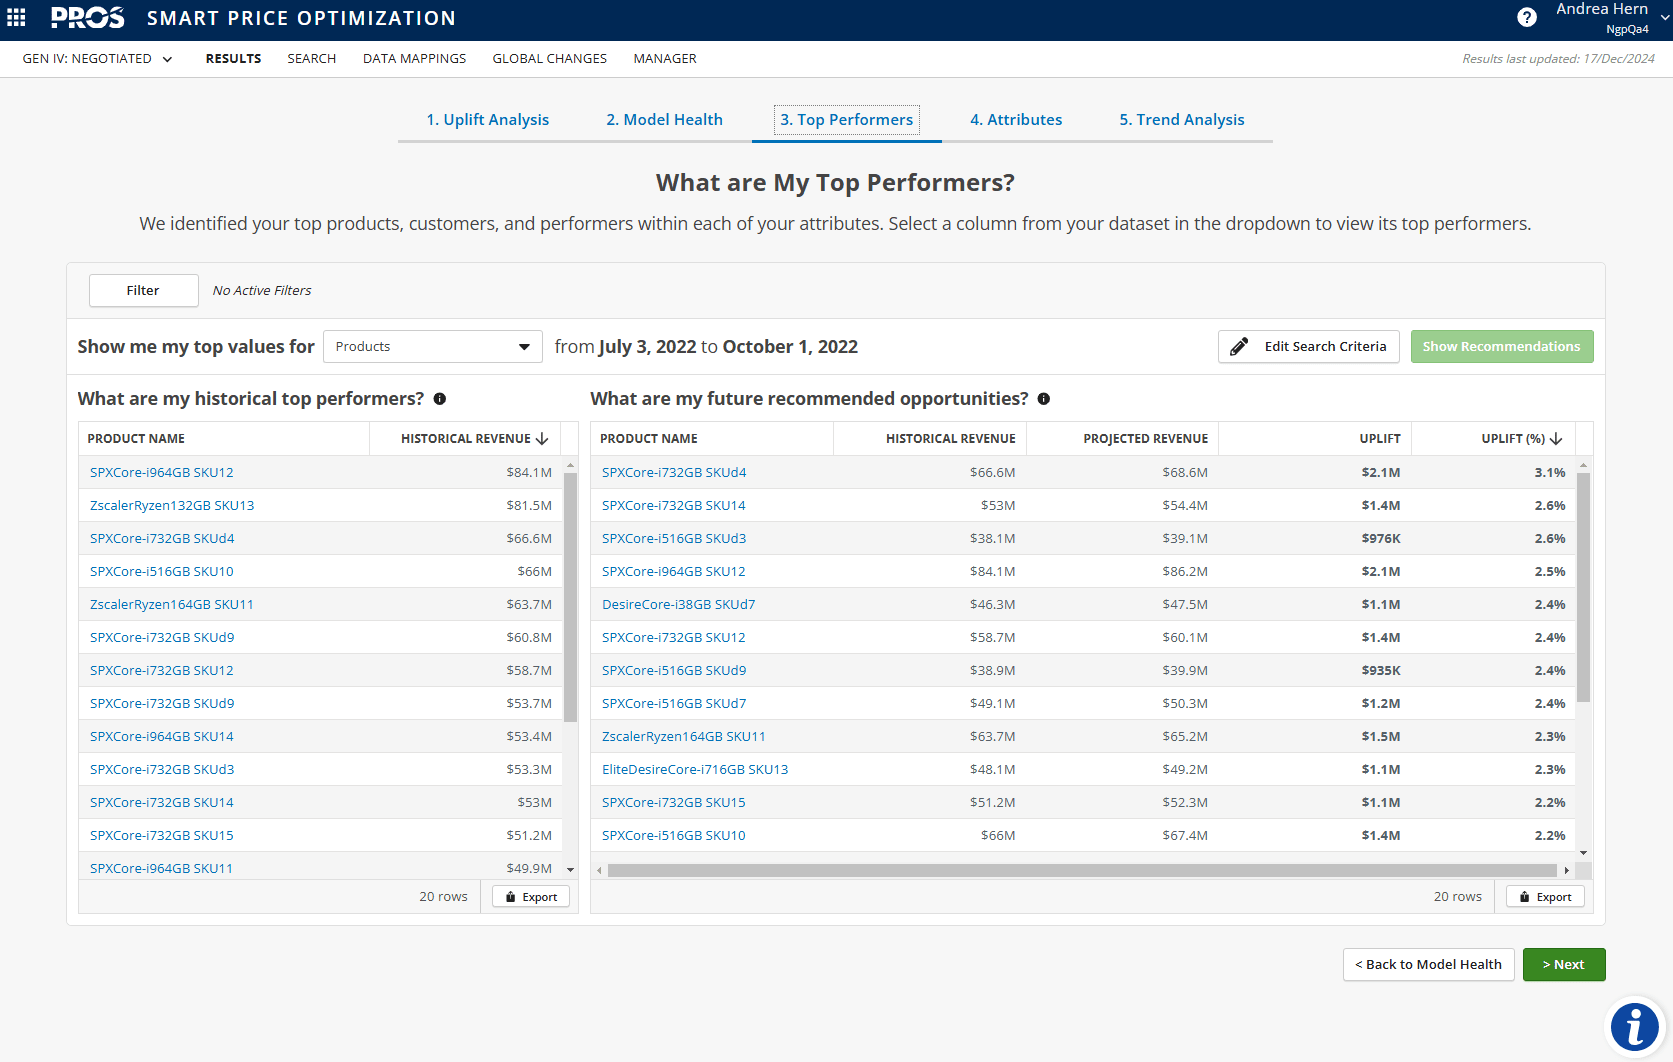
This feature started as a simple list of high-margin or revenue products, but it evolved dramatically thanks to sales. They were relentless about getting the drilldown functionality—honestly, I think they asked about it in every meeting for months! But their persistence paid off. We eventually added filters, drilldowns, and the ability to identify future opportunities, turning Top Performers into a dynamic tool that businesses can use to not only see historical success but also to proactively target key areas for growth.
- Attribute Influence: Unpacking the Drivers
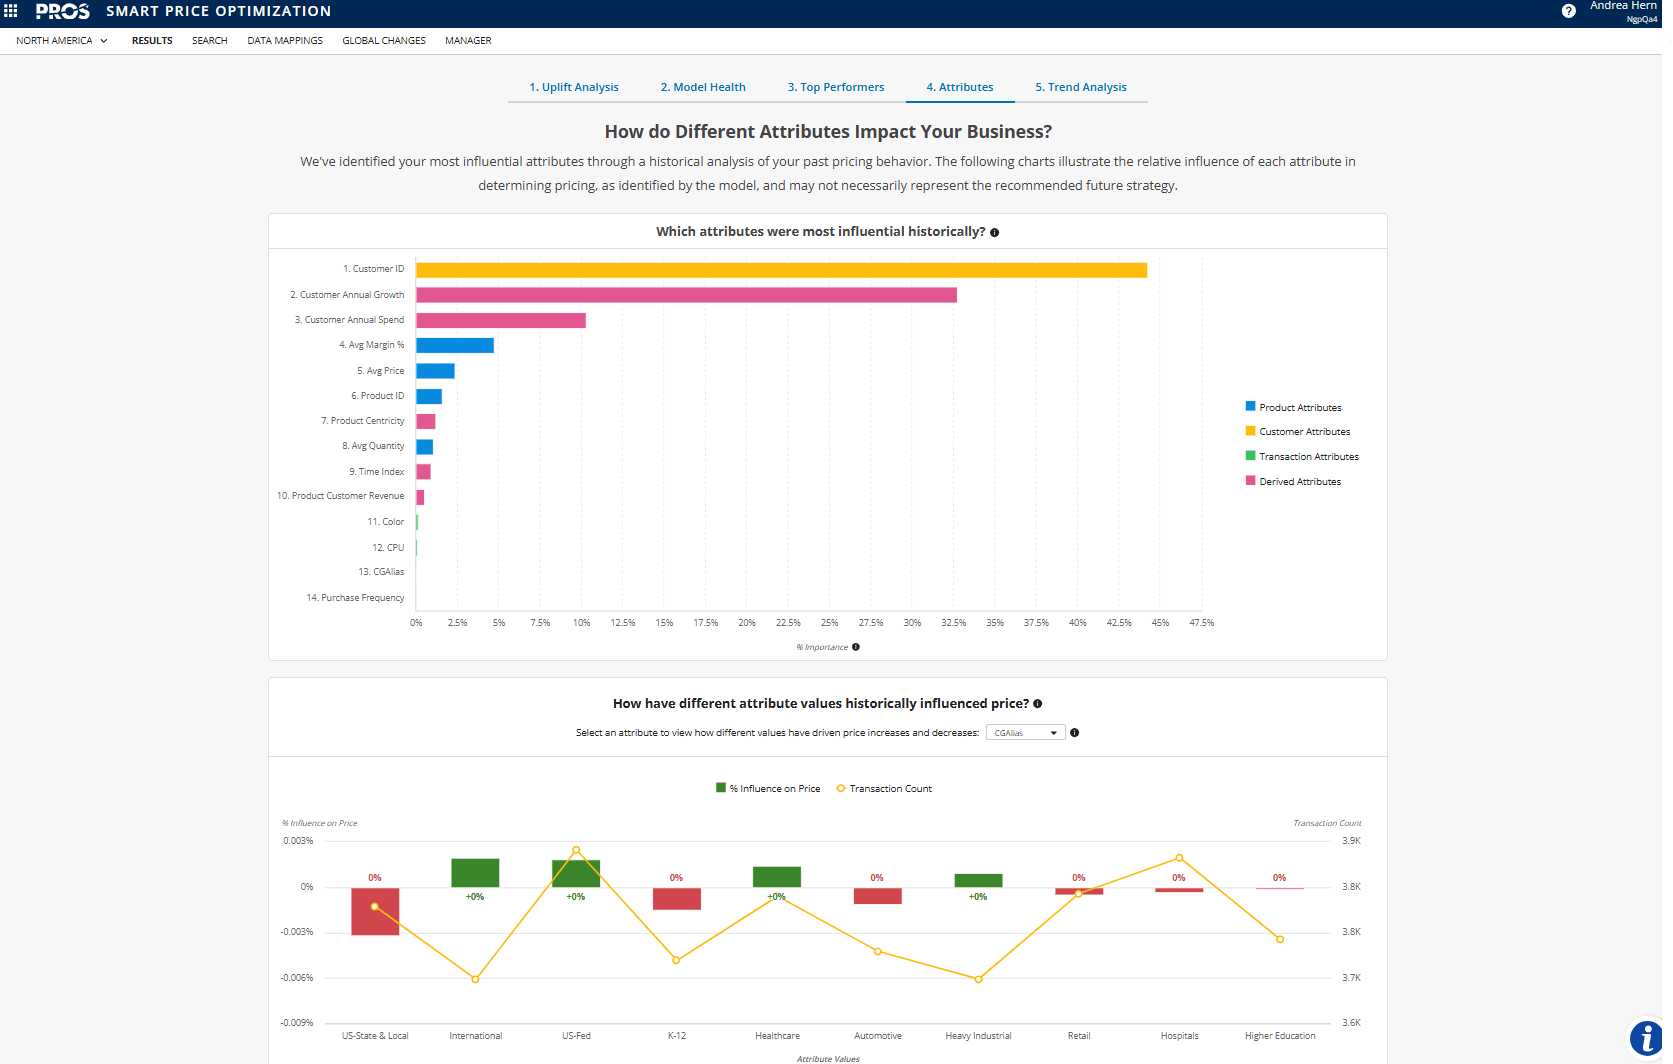
One of the most challenging aspects of pricing AI is understanding which factors influence price changes the most. The Attribute Influence feature took months of back-and-forth with our science team to fine-tune. It now highlights the most impactful pricing factors and allows users to dive deep into the data, showing exactly how individual attributes—like product features or geographic location—affect pricing strategies. While building the Attribute Influence screen, we received an amusing (and very helpful) suggestion from one of our sales teammates. During a review session, they casually mentioned, “Can we make those bars wider? They look like toothpicks.” It was a simple request, but it reminded us how important accessibility is. Wider bars not only made the data more readable but also improved the user experience for everyone.
- Trend Analysis: Understanding Change Over Time
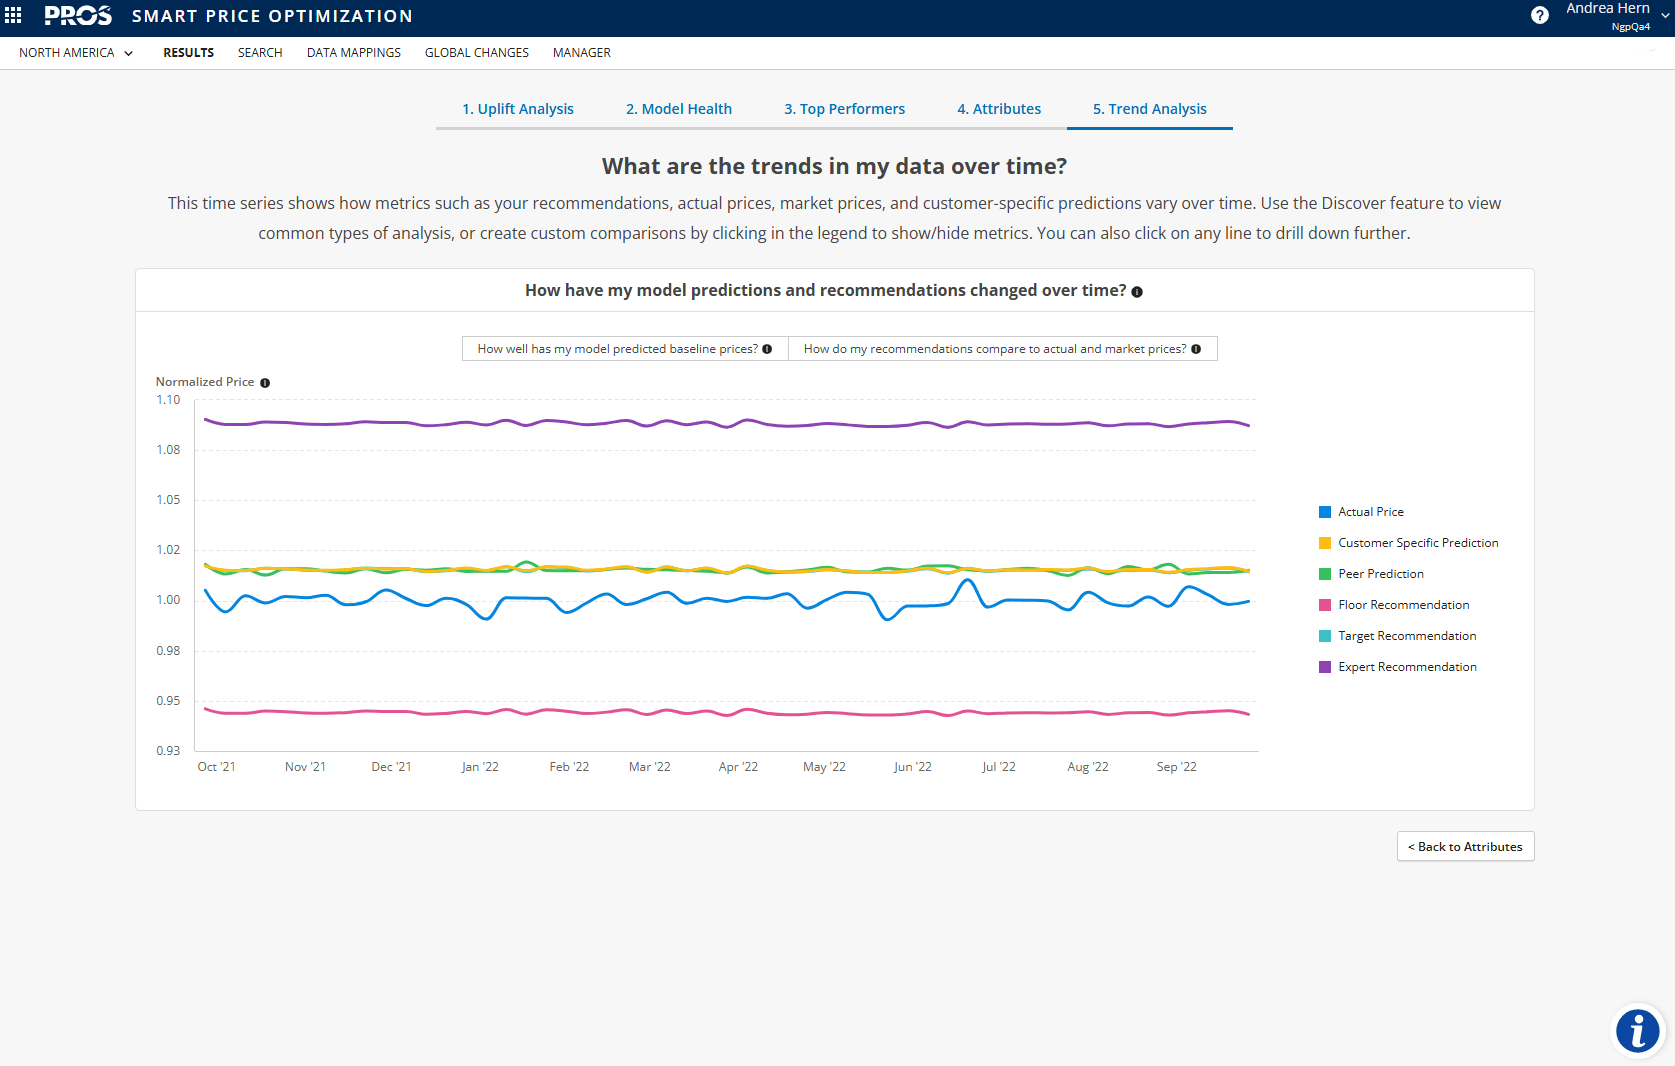
We knew that pricing is never static, so we developed Trend Analysis to show how key metrics evolve over time. The ability to track AI recommendations and pricing behaviors, and compare them with market conditions, turned out to be a game-changer for our users. By observing these trends, businesses can make proactive, data-driven decisions instead of reacting to anomalies.
From Concept to Completion: Lessons Learned
As we continue building on the foundation of this initiative, I’ve taken time to reflect on some of the key lessons learned so far, I reflected on some of the key lessons I learned along the way:
- Customer-Centric Design: Keeping the customer at the heart of every decision was crucial. We consistently asked ourselves: How will this feature make the AI more transparent and actionable for the end-user? This focus kept us aligned and ensured that we were solving the real problems our customers face every day.
- Simplify complexity: One of my biggest takeaways was the need to make complex concepts simple. Explainability isn’t just about making models transparent; it’s about making the insights understandable and actionable for everyone.
- Collaboration is Everything: The most important takeaway for me was how essential cross-functional collaboration is in product development. From science and engineering to sales and customer success, every team played a critical role in shaping Aggregate Analytics into a solution that truly delivers value to our customers. Nothing was perfect from the start. The features evolved through customer feedback, internal testing, and constant iteration. We refined our approach with each round of input, ensuring that by the time we launched, we had a solution that was not just innovative but also useful and intuitive.
- The Power of Iteration: Nothing was perfect from the start. The features evolved through customer feedback, internal testing, and constant iteration. We refined our approach with each round of input, ensuring that by the time we launched, we had a solution that was not just innovative but also useful and intuitive.
The Results: Explainability Delivered
Now that we’ve brought Aggregate Analytics to life, we can finally see the results. Customers are using the Uplift Analysis tool to demonstrate clear, measurable benefits of AI-driven pricing decisions. They’re trusting the Model Health dashboard to ensure their systems are running smoothly and using Top Performers to target high-value opportunities. As Julia Brasher, Director of Pricing at Highline Warren recently said:
“The best part of Neural Networks is just how good the price is. It is doing more efficient exact math than my team could do in the processes that we had, and the sales reps, have been using the phrase ‘PROS knows’, and they have had great adoption to the price.”
This past year has been a transformative one, both for the product and for me as a Product Manager. I’m excited to see how Aggregate Analytics continues to help our customers drive value through explainable AI pricing. We’ve taken the complexity of neural networks and turned it into a transparent, understandable process. And the journey doesn’t end here—there’s always room to iterate, improve, and push the boundaries of what’s possible.
